Analyst Crypto Patel flags SOL at key technical level as competing forecasts diverge
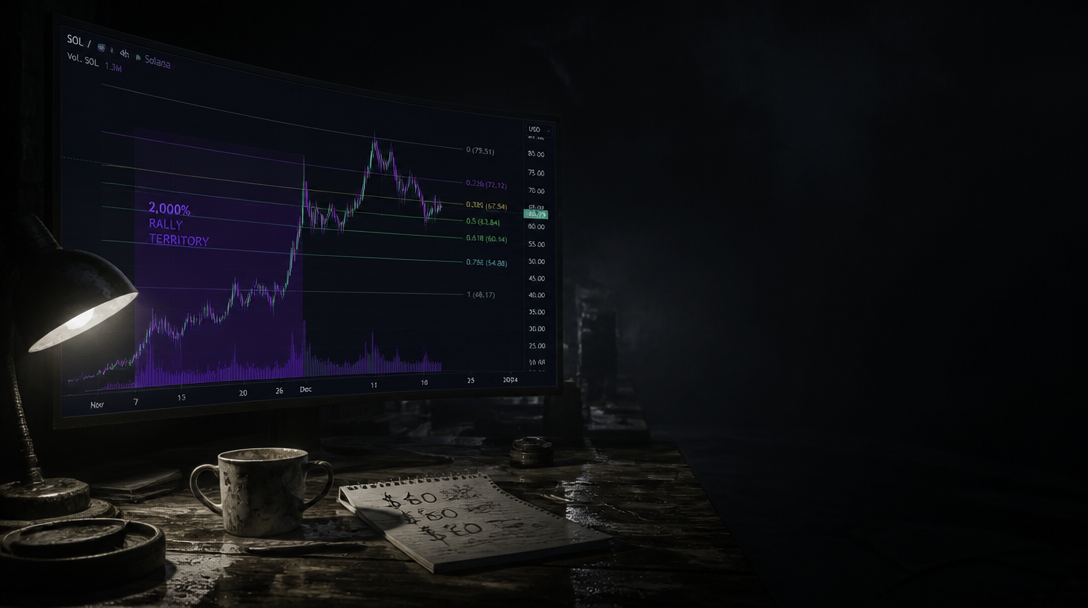
Market analyst Crypto Patel has highlighted that Solana is currently trading near a historical Fibonacci Retracement zone between 0.5 and 0.618 that previously triggered a 2,000% rally during the 2023 cycle. SOL is trading around $65, placing it within the $40 to $60 range where this technical level sits.
The current price action follows months of selling pressure. Solana has declined roughly 20% over the past week and 32% over the past month, according to the analysis.
Crypto Patel argues the setup presents significant upside potential if market conditions align. “If history were to play out as expected, Solana could finally break out of its prolonged price slump and consolidation phase, potentially paving the way for new all-time highs,” Patel said. The analyst also noted the psychological dimension of a potential parabolic move: “The real question is not whether Solana can hit $1,000 during this cycle, but whether investors will have enough exposure to the asset if the price actually goes parabolic.”
The 0.5 to 0.618 Fibonacci Retracement zone has historically functioned as a major accumulation area for traders, according to the analysis. The Martini Guy, a crypto expert on X, confirmed that Solana historically moves very quickly through the $40 to $80 range. However, The Martini Guy offered a starkly different outlook, warning that “Solana’s price faces a serious risk of a decline.” The Martini Guy also noted that Solana has broken down on the weekly chart and is trading in a highly illiquid price zone.
The competing forecasts reflect broader uncertainty about Solana’s near-term direction. Crypto Patel’s bullish case hinges on altcoin season unfolding and price structure breaking above current consolidation levels. The Martini Guy’s bearish view emphasizes technical weakness and the risk of declines toward $40 or even $25 if market sentiment deteriorates further.
Solana’s price structure remains inherently bearish due to broader market sentiment and volatility, according to the analysis, despite the technical setup that preceded prior rallies. The lack of sustainable bullish catalysts has weighed on investor confidence in recent months.
Traders monitoring SOL should note the conflicting signals. The $40 level represents the lower end of the historical range where Solana tends to consolidate, while $80 marks the upper end through which the asset has moved quickly historically. A break above $80 could signal the beginning of the rally Patel envisions, whereas a drop below $40 would validate The Martini Guy’s downside scenario.