Sharp drop to $60,700 and rebound above $63,000 trigger leverage reset
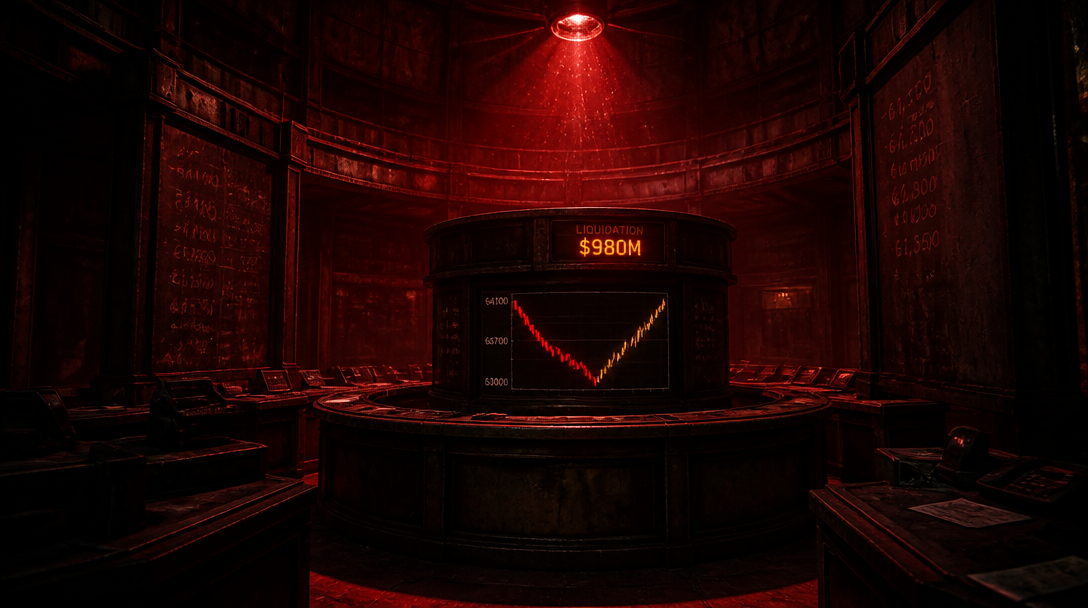
Bitcoin’s swing from the mid-$64,000 area to a low near $60,700, followed by a rebound above $63,000, triggered roughly $980 million in leveraged liquidations across crypto markets within 24 hours, according to liquidation data and technical analysis from multiple sources.
The move unfolded in two distinct phases. Bitcoin’s initial drop from $64,100 to $60,700 liquidated approximately $456 million in leveraged positions. The subsequent rebound above $63,000 then triggered a second wave of $524 million in liquidations, completing the reset cycle in less than 24 hours.
Liquidation heatmaps from Coinglass identify two key zones where positions were concentrated. The downside cluster spans $58,500 to $61,000, with a near-term support level at $59,150 sitting inside that range. On the upside, liquidation liquidity concentrates between $63,500 and $66,000.
Trade Nation’s technical analysis places Bitcoin in a corrective phase on the four-hour chart. The firm identifies 66,247 as a pivot resistance level, close to the upper liquidation zone. Below that, support levels sit at 59,150, 56,900, and 54,920. Upside targets above the pivot extend to 67,950 and 69,940.
virDeStatera’s one-hour analysis notes that Bitcoin swept a new overnight high at 64,234 before the decline. Key resistance sits at 65,890. The intraday support band ranges from 63,127 to 63,354, with a broader support at 62,459. A wider thesis line holds at 60,171.
CryptoReviewing and Trade Nation both highlight the mechanics underlying the liquidation cascade. When volatility rises and liquidity thins, liquidation levels can act as price magnets. Forced liquidations add momentum to directional moves, amplifying swings in both directions. The liquidation maps themselves do not predict where price must go, but they show where concentrated leverage may be vulnerable to unwinding.
The $59,150 support level identified by Trade Nation sits inside the wider $58,500 to $61,000 downside liquidity region, creating a nested support structure. Similarly, the 66,247 pivot sits near the upper $63,500 to $66,000 liquidation zone, suggesting resistance clusters at multiple levels.
The cascade highlights how leverage concentration in thin liquidity environments can amplify price swings. Traders monitoring liquidation heatmaps use them to identify zones where cascading liquidations may accelerate moves, though the maps remain a structural snapshot rather than a price forecast.
Liquidation Zones and Technical Structure
The liquidation event underscores the relationship between leverage density and volatility. Bitcoin’s move from $64,100 to $60,700 and back above $63,000 occurred within a single 24-hour window, creating two separate liquidation events as price crossed key concentration zones.
Analysts tracking both liquidation heatmaps and technical levels note that the proximity of Trade Nation’s pivot at 66,247 to the upper liquidation zone between $63,500 and $66,000 creates a structural resistance cluster. Conversely, the $59,150 support identified by Trade Nation overlaps with the broader downside liquidity region, potentially making that level a focal point for support or further liquidations depending on directional momentum.