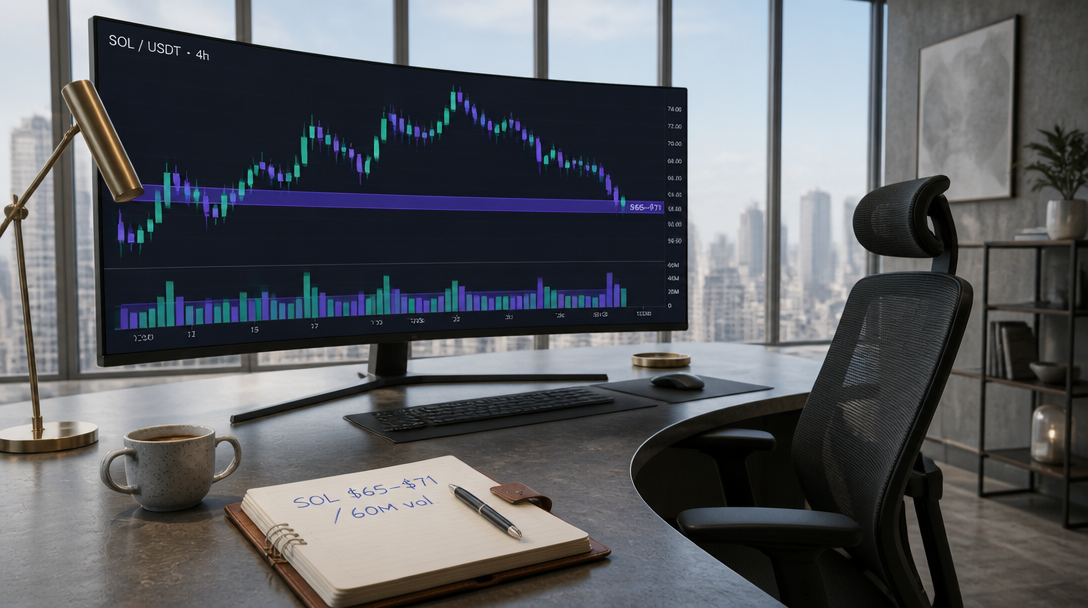
Crypto analyst Ali Martinez has identified a $65 to $71 price range as a critical support level for Solana, citing more than 60 million SOL that reportedly changed hands in that zone.
Martinez’s analysis centers on historical transaction volume clustering, a method that treats price levels where large amounts of a token have exchanged hands as meaningful reference points for future price action. Unlike arbitrary technical levels, these zones reflect actual market participation and can influence trader behavior at scale.
Why Transaction History Matters
When significant volume concentrates in a specific price band, that zone becomes a focal point for market participants. Buyers may view it as a second opportunity to enter. Existing holders may add positions if the level holds. Short-term traders may use it as a risk management marker. The mechanism works in reverse as well: if Solana price decisively breaks below the $65–$71 range, the former support can flip into resistance and force attention toward deeper liquidity levels.
For SOL bulls, defending the $65–$71 range is essential to the narrative that the token is consolidating rather than entering a breakdown. A sustained hold signals accumulation and potential recovery. For bears, a clean loss of that zone would suggest the market is searching for lower-value equilibrium.
Solana’s Market Dynamics
Solana attracts intense scrutiny from traders and analysts because of its combination of retail interest, active on-chain trading volume, and a developer ecosystem that continues to expand. The token’s price action often reflects both speculative positioning and genuine network activity, making volume-based analysis particularly relevant.
Martinez did not provide the specific date when the 60 million SOL volume occurred or when the analysis was published. The current price relationship to the $65–$71 zone was not disclosed.
Support zones identified through transaction history have gained credibility among technical traders as more reliable than chart-based levels alone, because they represent actual cost bases where market participants have skin in the game. Martinez’s flagging of the $65–$71 band for Solana fits that framework and adds a quantifiable reference point for monitoring the token’s near-term direction.