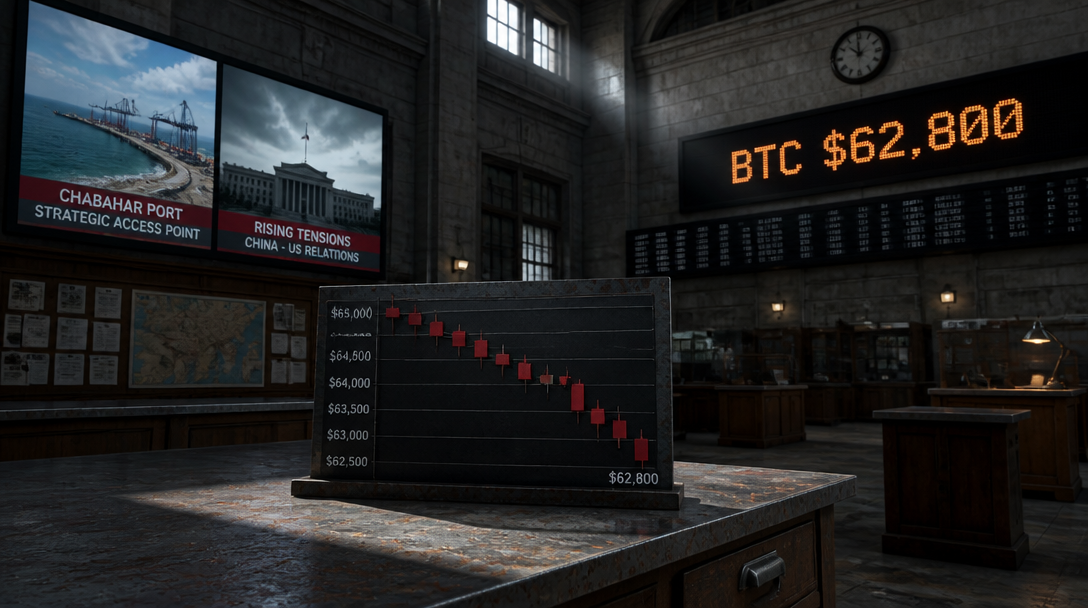
Bitcoin traded near $62,800 on Friday, extending a broader sell-off across global equities and commodities as U.S. airstrikes on Iran and a political dispute between Washington and Beijing pushed investors out of risk assets.
The price decline marked a 1.4% slide from Thursday’s $65,000 level, with Bitcoin slipping below its 50-day simple moving average. The move came hours after the U.S. struck five bridges in Iran’s Hormozgan province and damaged the maritime control tower at Chabahar port. Separately, President Donald Trump declassified intelligence reports alleging Chinese interference in U.S. elections, claiming Beijing obtained 220 million voter records. China’s embassy denied the allegations, and the dispute could strain ties before Trump’s September meeting with Xi Jinping.
The geopolitical shock rippled across regional markets. Japan’s Nikkei 225 dropped 4% and entered a correction, falling more than 10% from its June 25 peak. Kioxia lost 16.1%. Hong Kong’s Hang Seng shed 2%, while Shanghai Composite fell 3.1% to an 11-month low. Nasdaq futures pointed to a 1.6% decline. WTI crude traded near $79, up 15% across five sessions.
Liquidity Dynamics Outweigh Geopolitical Risk
Nicolai Sondergaard, research analyst at Nansen, attributed the move primarily to monetary conditions rather than Middle East tensions. “The inflation and liquidity channel is doing more work here than the geopolitical hedge narrative,” Sondergaard said.
On-chain flows revealed a sharp but brief outflow during the strike hour. “Net outflows hit -18.3 BTC in the strike hour, then reverted to a post-shock average of +0.67 BTC per hour, meaning buyers returned within the same session,” Sondergaard said. This pattern echoed prior escalations in the region. “Prior Middle East escalations produced the same pattern: short-duration flush, accumulation resumes,” he added.
Spot Bitcoin ETFs recorded $510 million in inflows across three sessions this month, a reversal from a $2.73 billion outflow streak. The rebound followed softer-than-expected inflation data released July 14. June’s headline inflation came in at 3.5%, below the 3.8% forecast, while core inflation read 2.6% against a 2.9% forecast.
On-Chain Metrics Signal Structural Support
Sondergaard highlighted on-chain valuation metrics that suggest the market is not driven by sentiment alone. The MVRV ratio stood at 1.205, with realized price at roughly $53,000 and long-term holder cost basis around $49,900. “MVRV sits at 1.205 with realized price at roughly $53,000 and the long-term holder cost basis around $49,900, which defines the structural floor. That is not the profile of a market running on geopolitical sentiment,” he said.
Smart-money traders held a 1.58 long-to-short ratio, while retail traders maintained a 1.79 ratio, both skewed toward long positions despite the day’s volatility.
Federal Reserve Decision Looms
The near-term catalyst for sustained inflows hinges on the Federal Reserve’s July 28-29 meeting. Market odds of a rate hike at that meeting fell from 40% to the low teens following the softer inflation print. The 10-year Treasury yield settled at 4.57%, and the dollar index traded at 100.77.
Sondergaard framed the FOMC decision as the key inflection point. “The FOMC meeting on July 28 to 29 is the actual binary. If the CPI data holds and the Fed signals a credible pivot path, the conditions for sustained ETF inflows are back in place,” he said.